Your Chart Is a Summary. The Order Book Is the Source.
Every candlestick you've ever looked at is a compressed summary of what already happened — the open, close, high, and low of a time period. By the time it forms, the action is over.
The order book is different. It's the live, real-time record of everything waiting to happen. Every limit order that hasn't been filled yet sits in the order book with its price and size visible. This is the actual market — the layer underneath price that determines where it goes next.
Most retail traders spend their entire careers looking at the summary and ignoring the source. This is the guide to fix that.
What the Order Book Actually Is
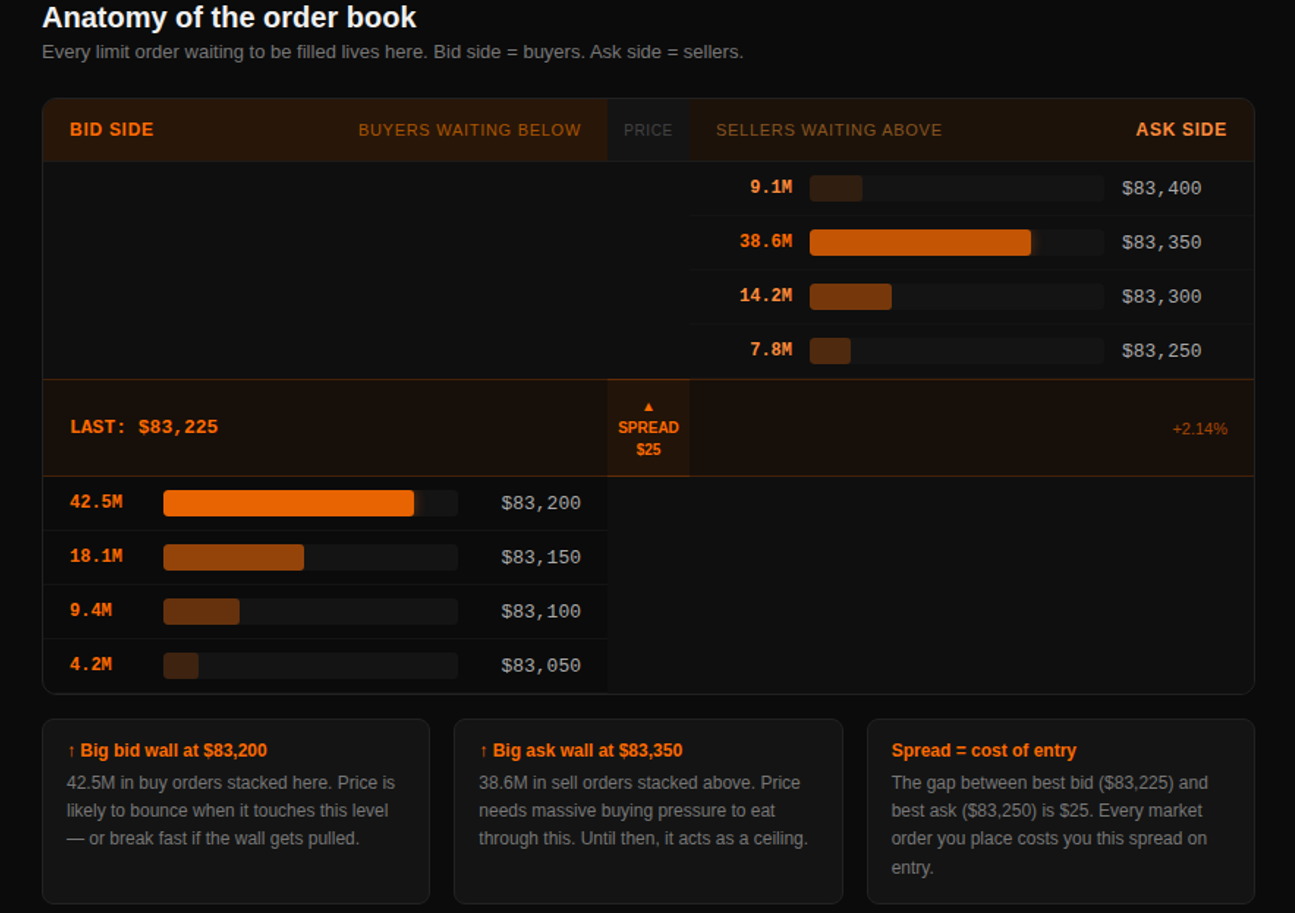
The order book is a continuously updated list of all outstanding buy and sell orders for an asset, organized by price level.
It has two sides:
The bid side — all resting buy orders, stacked below the current price. These are traders who have placed limit buy orders and are waiting for price to come to them. The highest bid is the best price a buyer is currently willing to pay.
The ask side — all resting sell orders, stacked above the current price. These are traders waiting to sell. The lowest ask is the cheapest price a seller is currently willing to accept.
Between the two sits the spread — the gap between the best bid and best ask. That gap is the cost of entering a trade with a market order.
The book updates in real time — millisecond by millisecond — as new orders are placed, existing orders are cancelled, and trades are matched. What you're seeing at any given moment is a live snapshot of where capital is waiting.
The Spread: Your Hidden Cost on Every Trade
The bid-ask spread sounds like a small technical detail. In practice it's the first cost you pay on every single market order you place.
When you buy at market, you fill at the ask — the lowest price someone is willing to sell. When you sell at market, you fill at the bid — the highest price someone is willing to buy. You enter at the ask, exit at the bid. The spread is the gap you have to overcome before you're in profit.
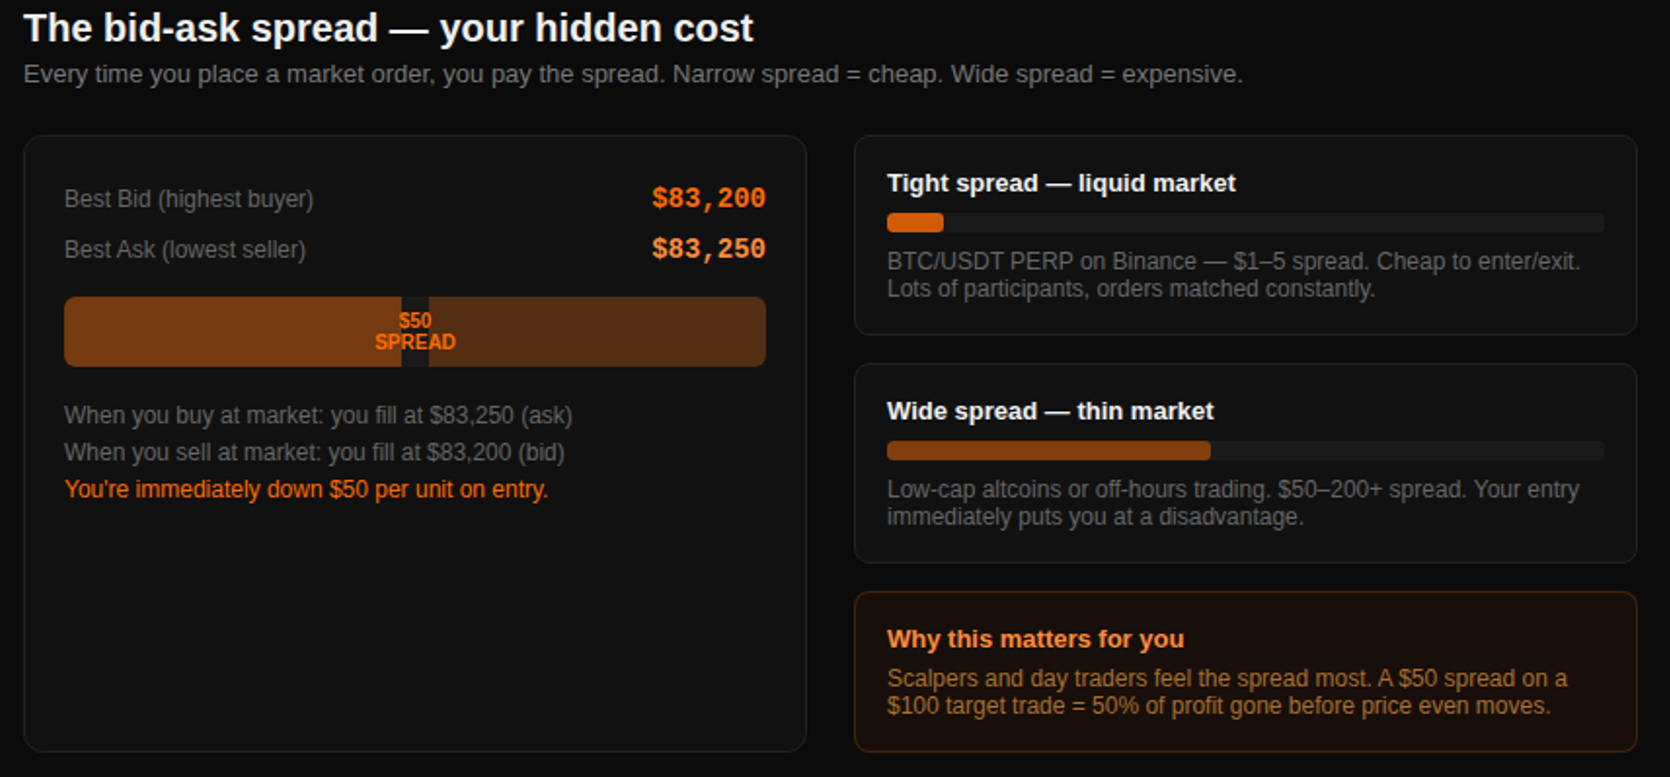
On BTC/USDT perpetuals on Binance, the spread is typically $1–5 — nearly invisible. But in thin markets, after hours, or during volatility spikes, spreads blow out fast. A $100 spread on a $200 target trade means half your profit is gone before price even moves.
Narrow spread = liquid market, cheap to trade. Wide spread = thin book, you're paying to get in and paying again to get out.
Depth of Market: Reading the Stacks
Order book depth — also called DOM (Depth of Market) — shows how many orders are sitting at each price level, not just the best bid and ask.
This is where it gets useful. When you can see that there's $42M in buy orders stacked at $83,200 and $38M in sell orders at $83,350, you're not guessing at support and resistance anymore — you're reading it directly from the book.
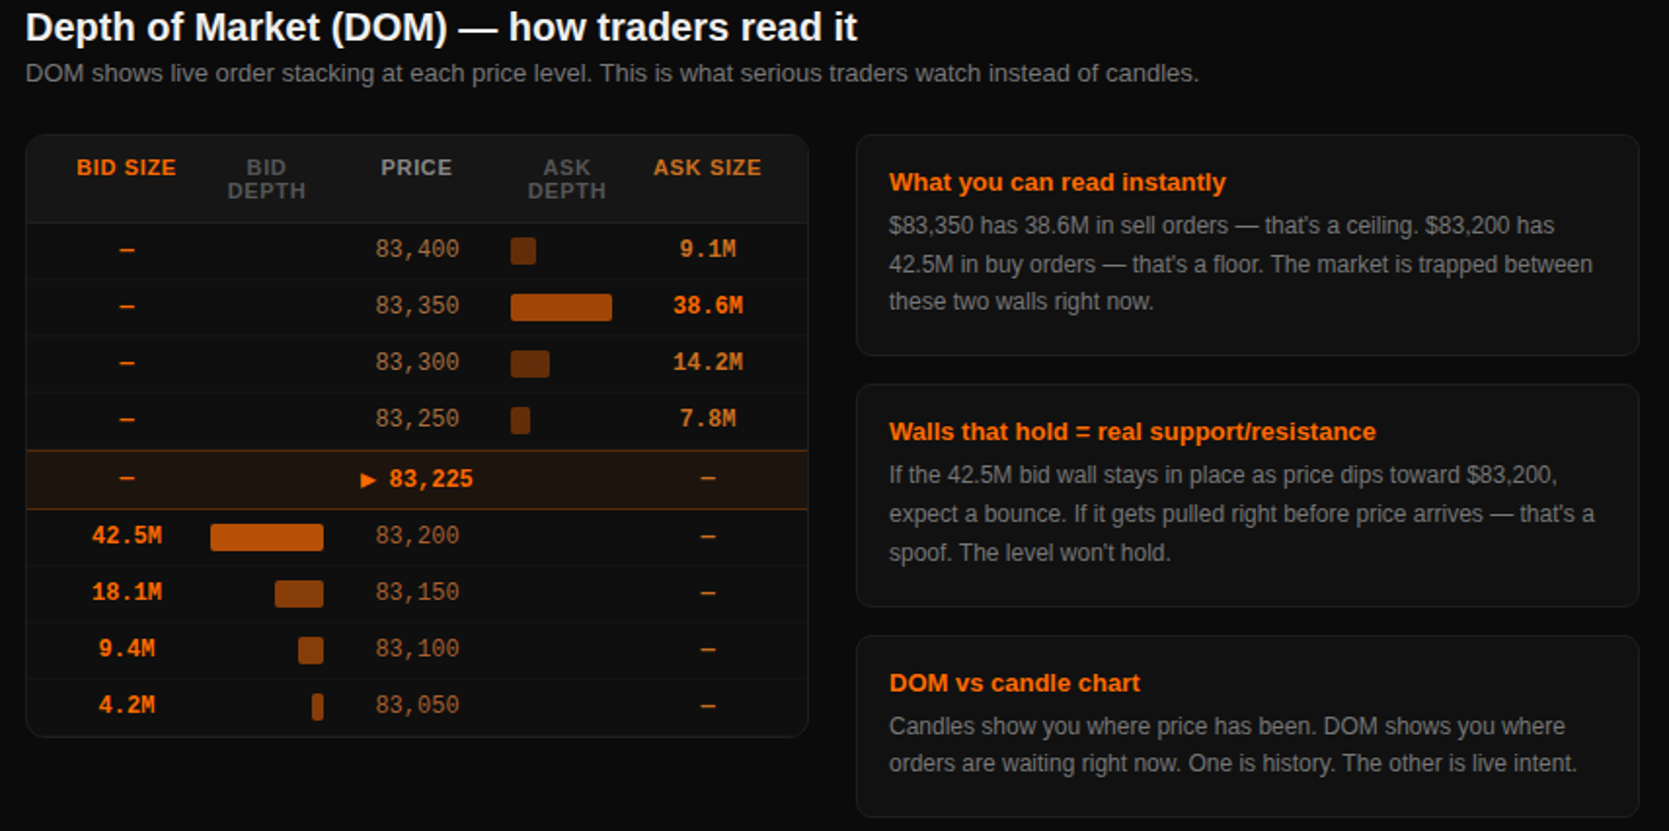
A large cluster of orders at a level does two things:
Acts as a wall. Aggressive market orders have to eat through that liquidity to push price past it. If the wall is thick enough, price stalls. You can see this happen in real time — price approaches the wall, slows down, tests it, and either bounces or breaks through.
Acts as a signal. The size of the orders tells you how seriously that level is being defended. $5M at a level is noise. $40M is a statement. When institutional players are protecting a level, they stack it. When they want price to move through it, they pull the orders right before price arrives.
That pulling of orders — placing a large visible order to influence price and then cancelling it before execution — is called spoofing. It's one of the most common manipulation tactics in crypto futures, and you can only see it if you're watching the order book in real time.
What Candles Hide That the Order Book Shows
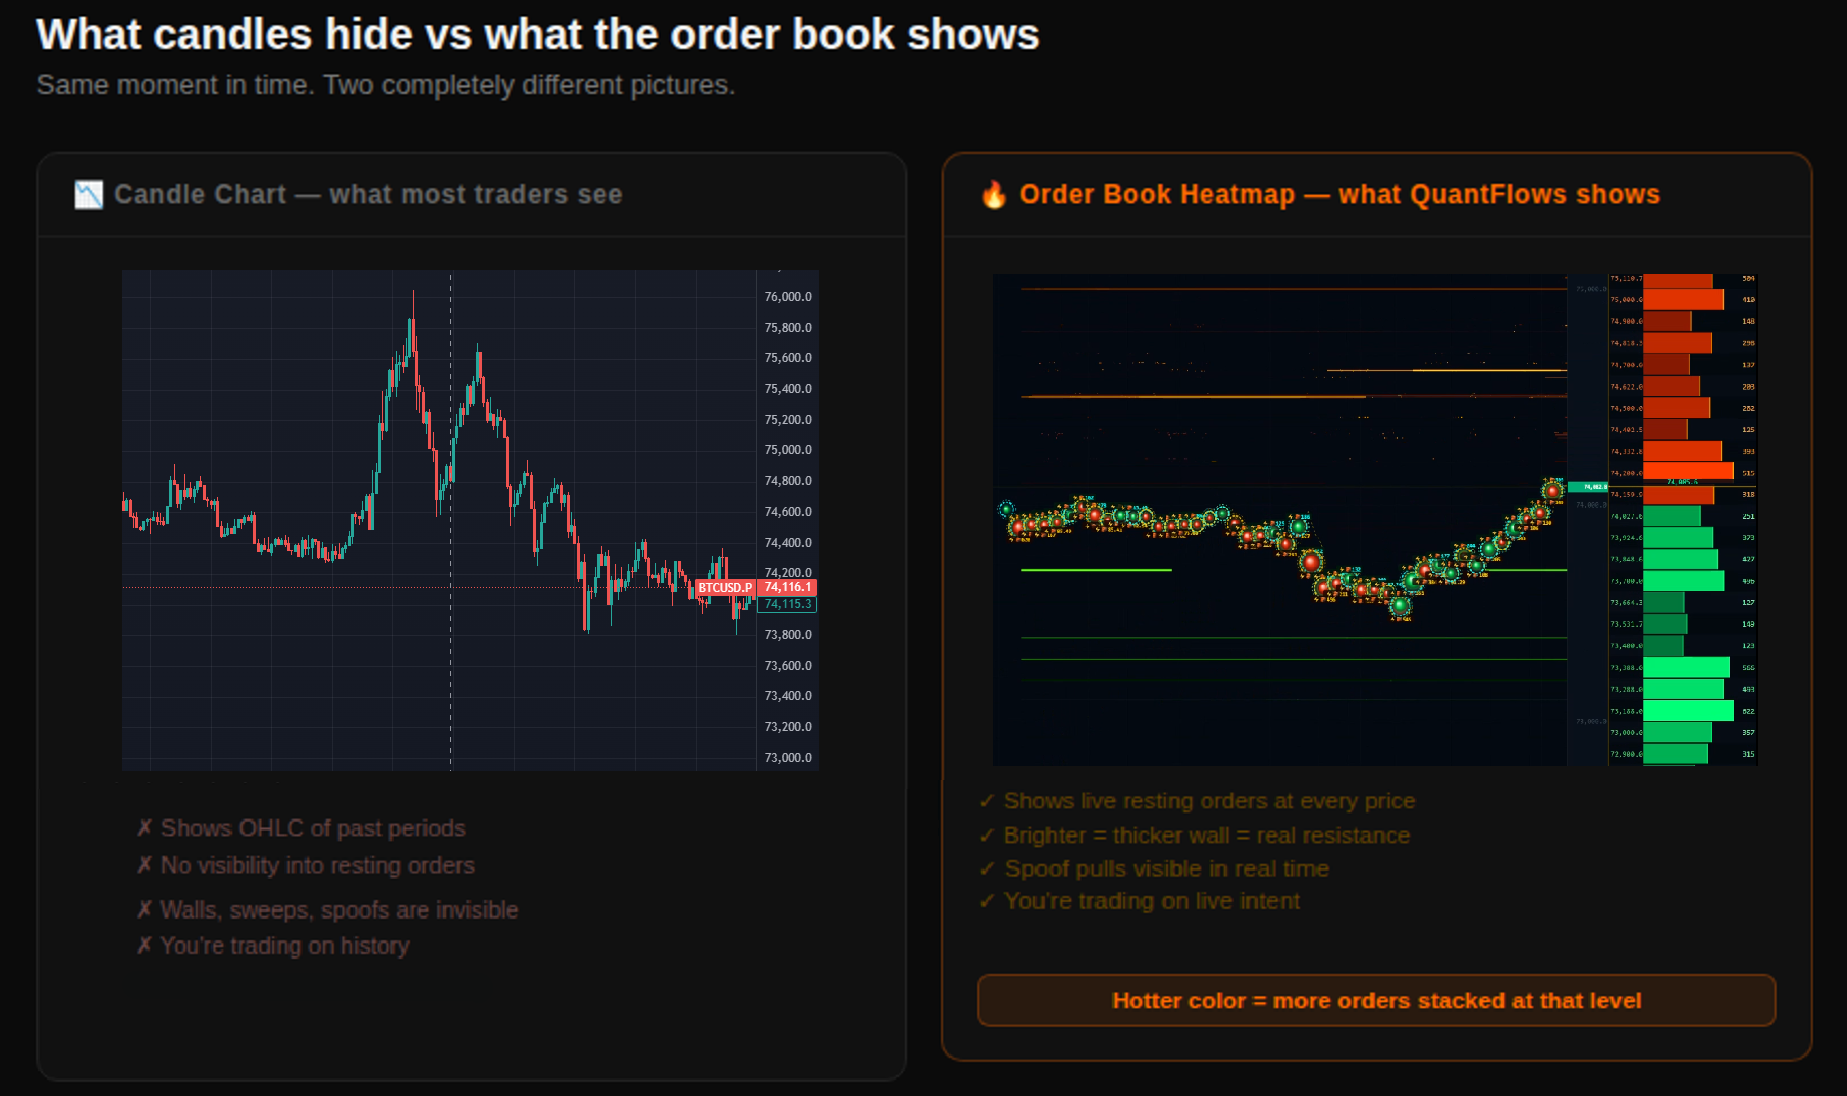
Put a standard candlestick chart and an order book heatmap side by side at the same moment. The candle shows you a single bar — open, close, high, low. The order book shows you:
- Where big buy orders is sitting right now
- Where big in sell orders is forming a ceiling
- Which walls are growing and which are being quietly pulled
- Whether the current level is being actively defended or is about to give way
Candles are useful for pattern recognition on historical data. But for real-time decision making — for knowing whether a level will hold before price gets there — candles can't answer that question. The order book can.
This is the core of why order flow trading gives an edge. You're reading live intent, not past outcome.
How the Heatmap Makes This Readable
A raw DOM ladder updates so fast it's hard to read in real time. The liquidity heatmap solves this by turning the order book into a color-coded visual that shows the history of where orders have been sitting over time.
Brighter, hotter colors = more orders stacked at that price level. Darker zones = thin liquidity, fewer orders. As price moves through time on the horizontal axis, you can see walls appearing, holding, fading, and being absorbed.
This is what QuantFlows visualizes. Instead of reading a number ladder that refreshes 10 times per second, you see the entire order book as a picture — where the weight of liquidity is, whether walls are stable or being pulled, and where price is likely to find resistance or support before it gets there.
What to Watch For in the Order Book
Once you start reading the book, there are specific patterns to look for:
Walls that hold — A thick cluster of orders that remains in place as price approaches it. The larger and more stable the wall, the more likely price bounces. This is real support or resistance — backed by actual orders, not just a historical candle pattern.
Walls that disappear — A large order that vanishes right before price reaches it. This is the spoof. The wall was placed to push price in a direction, not to actually trade. When it pulls, the level it was "defending" often breaks fast.
Thin zones above or below — Gaps in the order book with very few resting orders. When price enters these air pockets, it moves quickly with almost nothing to slow it down. Knowing where the thin zones are lets you anticipate where fast moves will happen.
Imbalance between bid and ask — If the bid side is significantly thicker than the ask side, there's more passive buying pressure than selling. Price is more likely to hold and push up. The reverse signals potential weakness.
The Order Book Doesn't Predict Price. It Reads Intent.
Nothing about order flow analysis is a crystal ball. Walls get pulled. Liquidity shifts. Markets fake moves all the time.
What the order book gives you isn't prediction — it gives you context. You stop asking "where do I think price will go?" and start asking "where is the actual weight of orders right now, and what is the market doing to that liquidity?" Those are better questions, and the order book has real, readable answers to them.
That shift — from guessing to reading — is the actual edge.
QuantFlows shows the live order book as a real-time heatmap across Binance, Bybit, OKX, and Hyperliquid simultaneously. See exactly where the walls are sitting before price gets there.