Stop Trading
Blind.
Institutional-grade order flow intelligence for retail traders. Visualize the full order book, track real flow, and enter with conviction — not FOMO.
✓ Free during beta · ✓ Live heatmap in 60s · ✓ No setup required
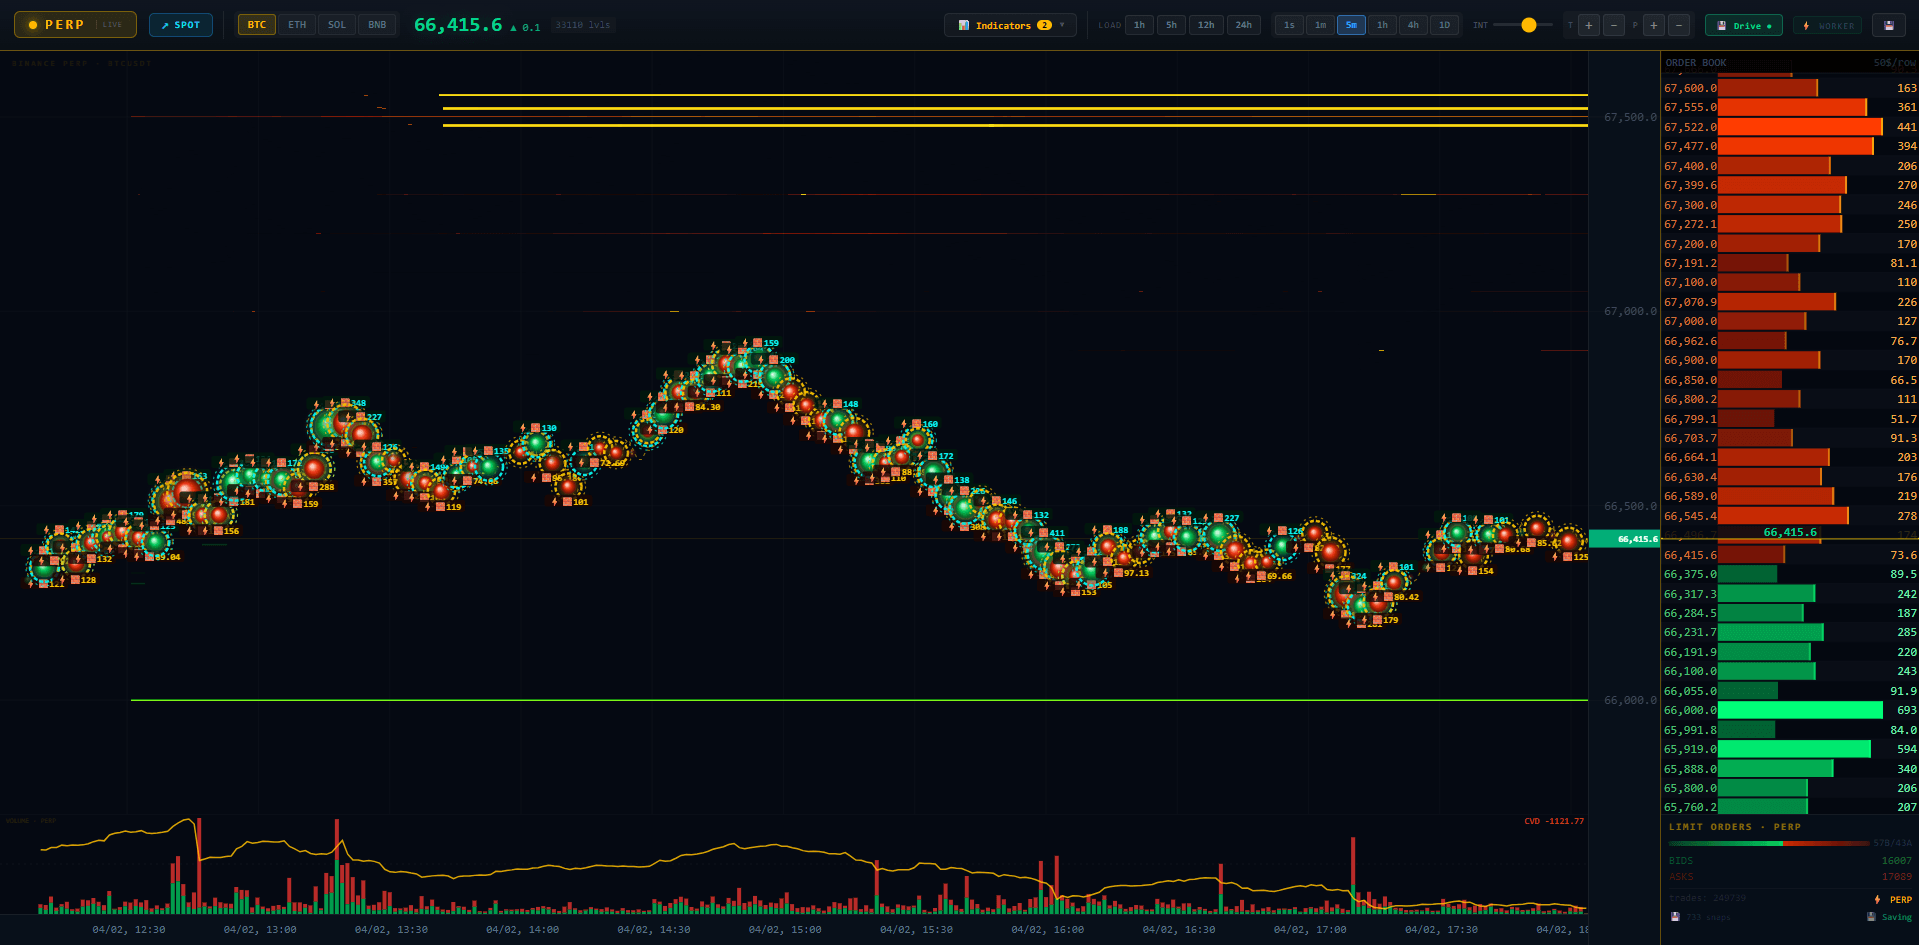
You're Not Losing Because of
Bad Strategy. You're Losing
Because You Can't See.
Institutions have real-time order book data, cross-venue depth, and AI-powered signals. Retail traders get a candlestick chart from 3 seconds ago. That's the real edge gap.
Three Layers of Edge.
Every tool you need to read the tape and enter with confidence — stacked into one platform.
Liquidity Heatmap
See exactly where liquidity is resting in real time — not guessing from yesterday's candles.
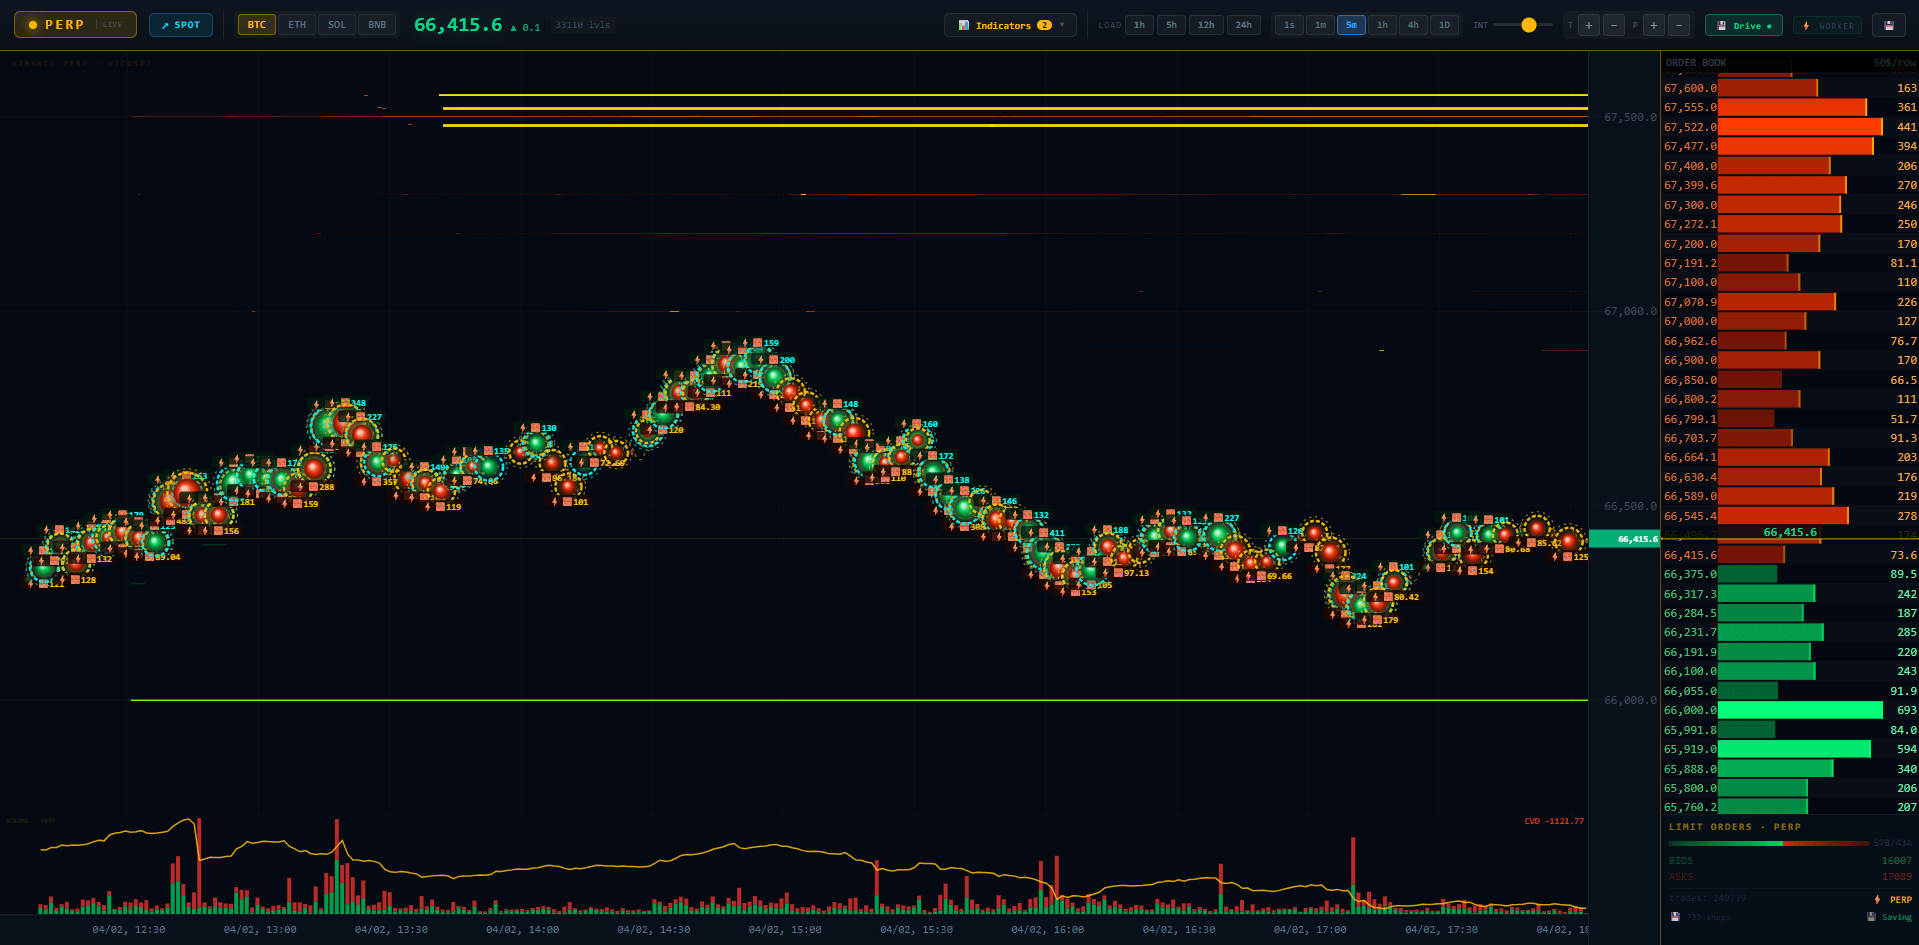
- Hotter color = thicker wall
- Spot buy walls, sell walls & spoof pulls instantly
- Historic replay on any session
Order Flow + Multi-Exchange
Confirm whether a move has real strength or is about to reverse — monitored across up to 5 exchanges simultaneously.
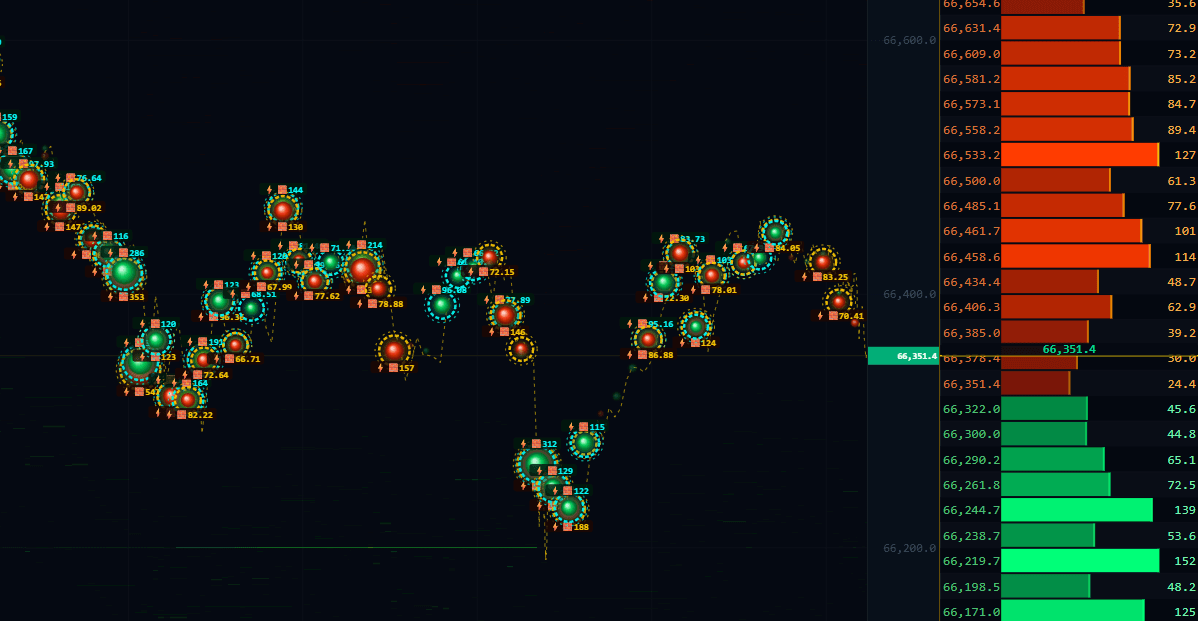
- Bubble Market Dots — absorption vs. exhaustion
- CVD, sweeps, liquidation prints & icebergs
- Monitor each exchange side by side — no more blind spots
Smart Alert Notifications
Set your conditions once. Get pinged the exact moment your setup triggers — no screen watching needed.
- Condition-based triggers: wall size, CVD shift, sweeps
- Alerts via Telegram, Email or Webhook
- Enter with conviction — not FOMO
Never Trade
Blind Again.
Institutional-grade liquidity intelligence for every trader. Free during beta — no card needed.
✓ Free during beta · ✓ No credit card · ✓ Cancel anytime