Everyone Talks About Liquidity. Almost Nobody Explains It Properly.
"Trade with the liquidity." "The market swept liquidity." "Low liquidity = risky." You've heard these phrases. But if someone asked you to define liquidity right now, in one sentence that actually explains how it works in the order book — could you?
Most traders can't. They've absorbed the word without the mechanics. This post fixes that.
What Liquidity Actually Is
Liquidity is one thing: orders sitting and waiting.
Every limit order that hasn't been filled yet is liquidity. When a trader places a buy limit order at $83,200, that order sits in the order book as available liquidity — a willing buyer at that price, waiting for a seller to arrive. The more orders stacked at a price level, the more liquid that level is.
High liquidity means lots of buyers and sellers are present at each price level. Your market order fills instantly, at or near the price you saw, with minimal slippage. Low liquidity means the opposite — thin book, few participants, and your order moves the market just by executing.
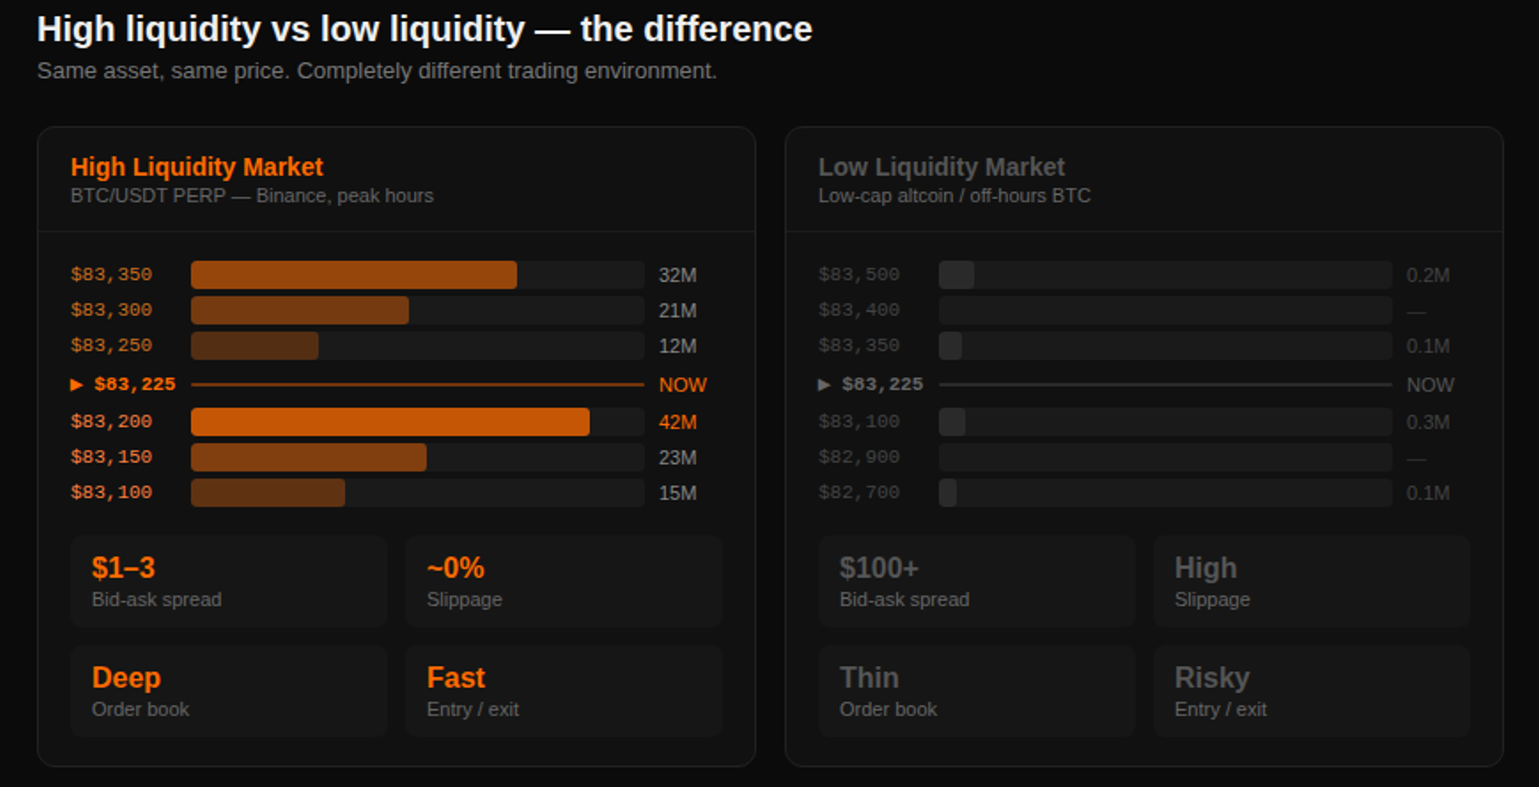
This is why the same trade behaves differently at different times. BTC on Binance during New York session hours: tight spread, deep book, fills instantly. BTC at 3am or a low-cap alt at any hour: wide spread, thin book, your order moves the price before it even fully fills.
Liquidity isn't a fixed property of an asset — it's a live condition that changes by the minute.
Why Liquidity Is the Real Driver of Price
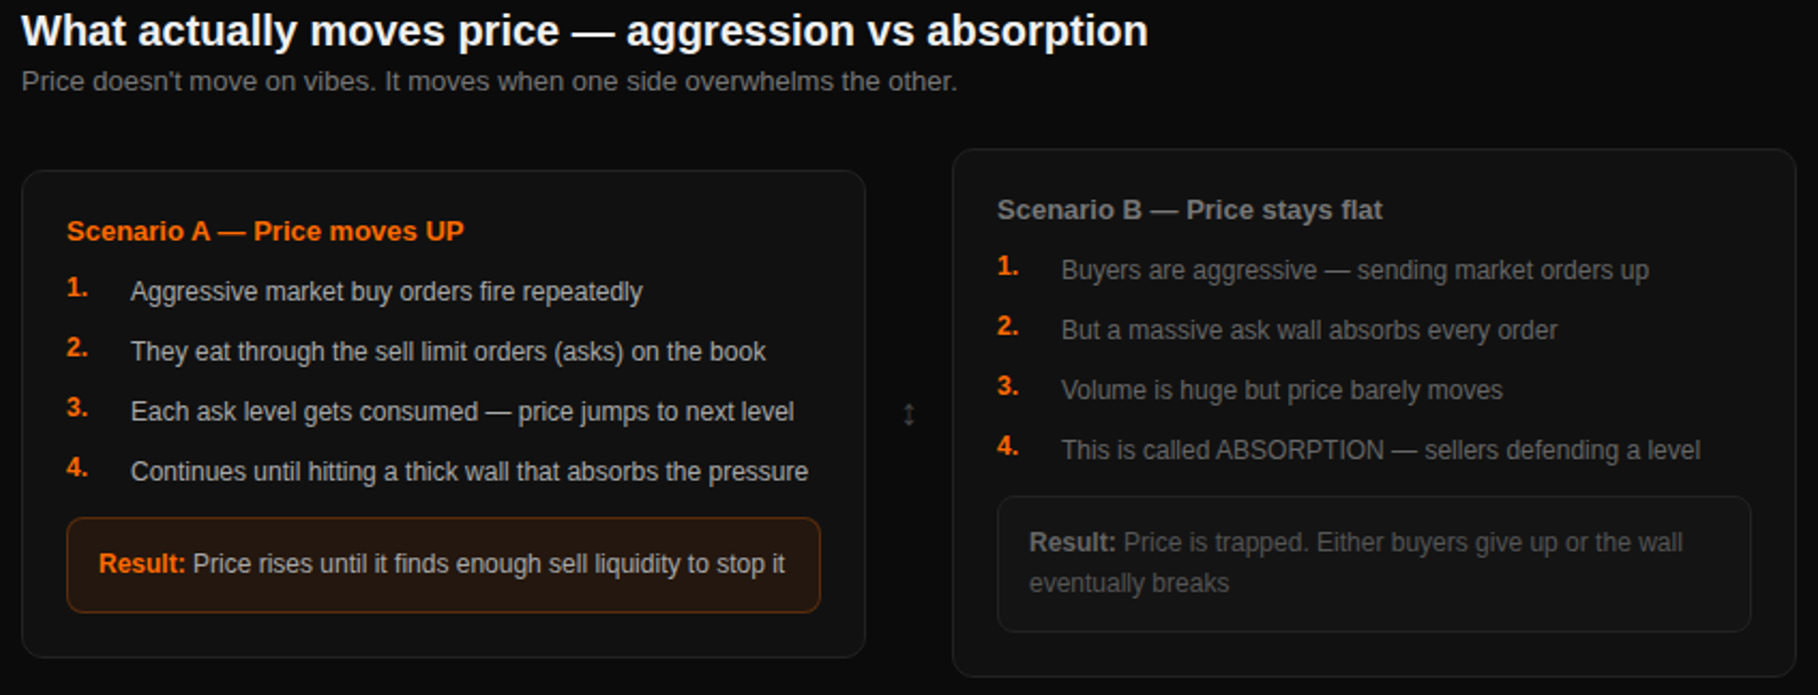
Here's the thing most chart traders miss: price doesn't move because of patterns. It moves because of what's happening to liquidity.
When aggressive market buy orders enter the market, they don't just "push price up" as an abstract force. They eat through the resting sell orders (asks) in the book, level by level. Each level that gets consumed moves price to the next. The speed and size of the move depends entirely on how much liquidity is sitting in the way.
Thick book, lots of orders at each level: price moves slowly, gets absorbed gradually, takes a lot of volume to push anywhere significant.
Thin book, few orders: even a moderate burst of aggressive buying can push price dozens of points in seconds. There's nothing to slow it down.
This is the mechanic behind every price move you've ever seen. Not the candle pattern. Not the indicator signal. Orders hitting liquidity — or failing to, when the liquidity isn't there.
Liquidity as a Leading Indicator
Most technical indicators are lagging — they react to price that has already moved. RSI, MACD, moving averages: they're all derived from past price data. By definition they confirm what already happened.
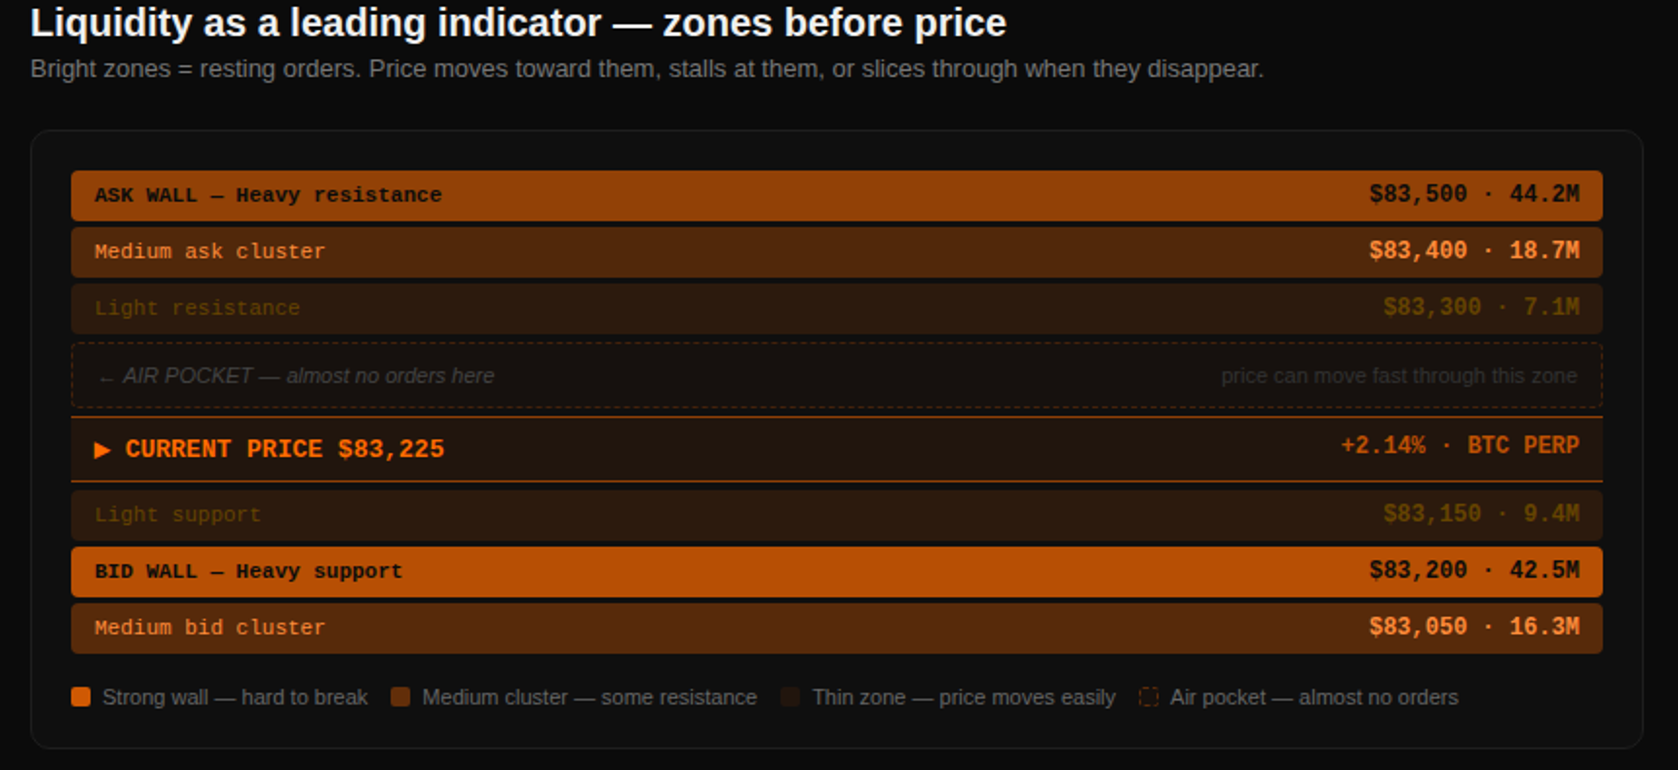
Liquidity leads. It shows you what's waiting for price before price gets there.
When you can see a $42M bid wall sitting at $83,200 on the heatmap, you know that level has real defense before price touches it. You're not guessing from a candle that bounced there last week. You're reading live intent — 42 million dollars in buy orders saying "we're here."
Three specific patterns where liquidity leads price:
1. Walls that hold. A thick cluster of orders at a level signals where price is likely to pause or reverse. The wall absorbs the incoming aggression. Price bounces not because of a chart pattern, but because the wall is simply bigger than the buying pressure hitting it.
2. Walls that disappear. A large order that vanishes right before price reaches it is a spoof — placed to influence behavior, then pulled. When it disappears, the level it was "defending" often breaks immediately. The heatmap makes this visible in real time. Candles can't show it at all.
3. Liquidity shifts before big moves. Right before a major directional move, you often see the order book reconfigure — walls getting pulled on one side, new stacking appearing on the other. This repositioning happens before price moves. If you're watching the book, you see the setup forming. If you're watching candles, you see it only after it's already happened.
Air Pockets: What Happens When Liquidity Disappears
Liquidity doesn't just vary in thickness — it can vanish almost entirely. When it does, the result is something called an air pocket: a zone in the order book where there are almost no resting orders at all.
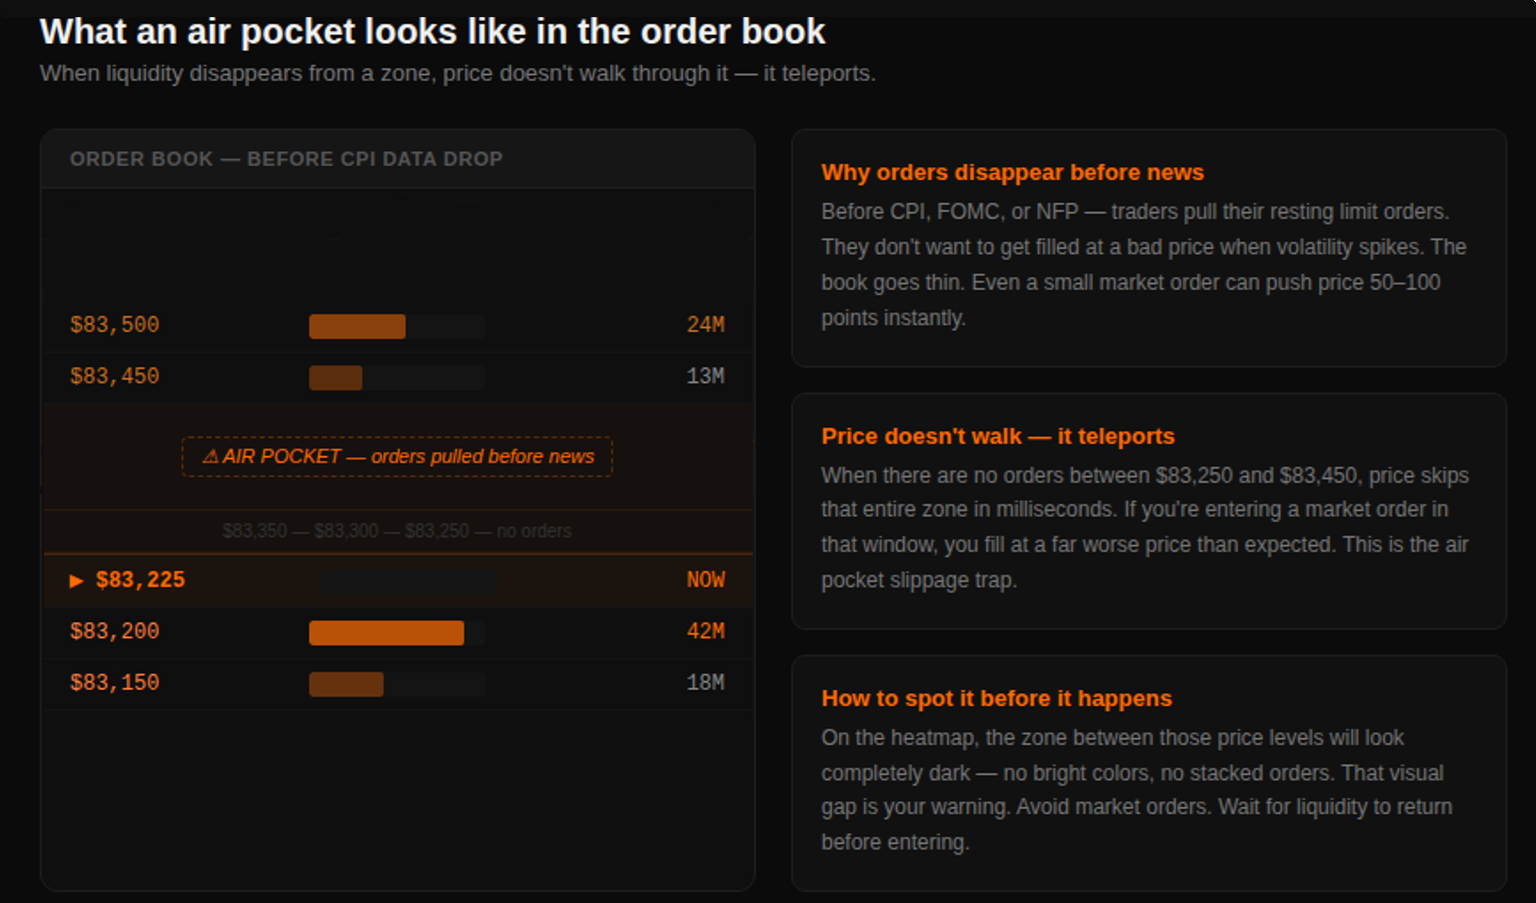
Price doesn't walk through an air pocket. It teleports.
When a market order hits a zone with no orders to absorb it, there's no friction. Price jumps through that entire range instantly, filling at whatever's on the other side. If you placed a stop or a market order expecting to fill around $83,300 and there's an air pocket between $83,250 and $83,450 — you're filling at $83,450. That's your slippage.
What creates air pockets:
Before major economic events — CPI, FOMC, NFP — traders pull their resting limit orders. They don't want to get filled at a random price when volatility explodes. The book goes thin. Even a small market order after the data hits can push price 50–100 points with almost no volume behind the move.
The same thing happens when large players pull their visible orders to prevent being front-run, or when a level that looked like a wall turns out to be a spoof — placed to push price, then cancelled the moment it arrived.
On the heatmap, air pockets are unmistakable. Where thick zones have bright, hot color, an air pocket is just dark. No color, no density. That visual gap is your warning.
The Three Liquidity Environments and How to Trade Them
Deep, stable book. Thick orders at each level, narrow spread, consistent stacking. This is the safe environment — enter with market orders, your fills are tight, your stops are predictable. BTC and ETH on major exchanges during active sessions.
Thinning book mid-session. Orders present but lighter than usual, spread slightly wider. Still tradeable but use limit orders for entries when possible. Be aware your stop placement needs more room — thin books mean bigger wicks.
Thin book or air pocket. Wide spread, sparse orders, possible gap zones visible on heatmap. This is not the environment for market orders or aggressive entries. Either wait for liquidity to return or size down significantly. The slippage risk is real and it's asymmetric — you only find out how bad it was after you're already filled.
What This Changes About How You Trade
Most retail traders pick levels based on where price bounced before. The logic is: "price respected this level last week, so it'll respect it again."
Sometimes it does. But you don't know why. You're drawing from history and hoping the present matches.
Reading liquidity changes the question. Instead of "did price bounce here before?" you ask: "are there actual orders defending this level right now?" That question has a real-time answer — visible in the order book, visualized on the heatmap.
A level with $40M in bids stacked behind it and a level with $2M are not the same level. They look identical on a candle chart. On the order book, they're completely different situations.
That difference — reading live intent instead of historical pattern — is where the actual edge in order flow trading lives.
QuantFlows shows you live liquidity across Binance, Bybit, OKX, and Hyperliquid in real time. See the walls, the air pockets, and the spoof pulls before price gets there.