The Real Reason Price Moves
Ask most traders why price moved and you'll get an answer about a pattern, an indicator signal, or "sentiment." These aren't wrong — but they're describing symptoms, not cause.
Price moves for one reason: aggressive orders hit passive orders, and one side runs out.
That's it. Every candle, every spike, every reversal you've ever seen is this mechanic playing out at different scales and speeds. When you understand it at the order book level, you stop reacting to what already happened and start reading what's about to happen.
The Three States: Aggression, Absorption, Exhaustion
Every moment in the market is one of three things:
Aggression — market orders firing repeatedly, eating through the resting limit orders on the opposite side of the book. Each level consumed pushes price to the next. Volume rises alongside price. This is a move with real force behind it.
Absorption — aggressive orders are firing, but a massive passive wall on the other side soaks up everything. Price barely moves despite huge volume. Someone is defending that level hard, matching every buy or sell that hits them. This is a battle — and the wall is winning for now.
Exhaustion — a move started with aggression, pushed price in one direction, but the orders driving it are running out. Volume starts shrinking. Price slows. The dominant side is losing steam. The move is likely ending.
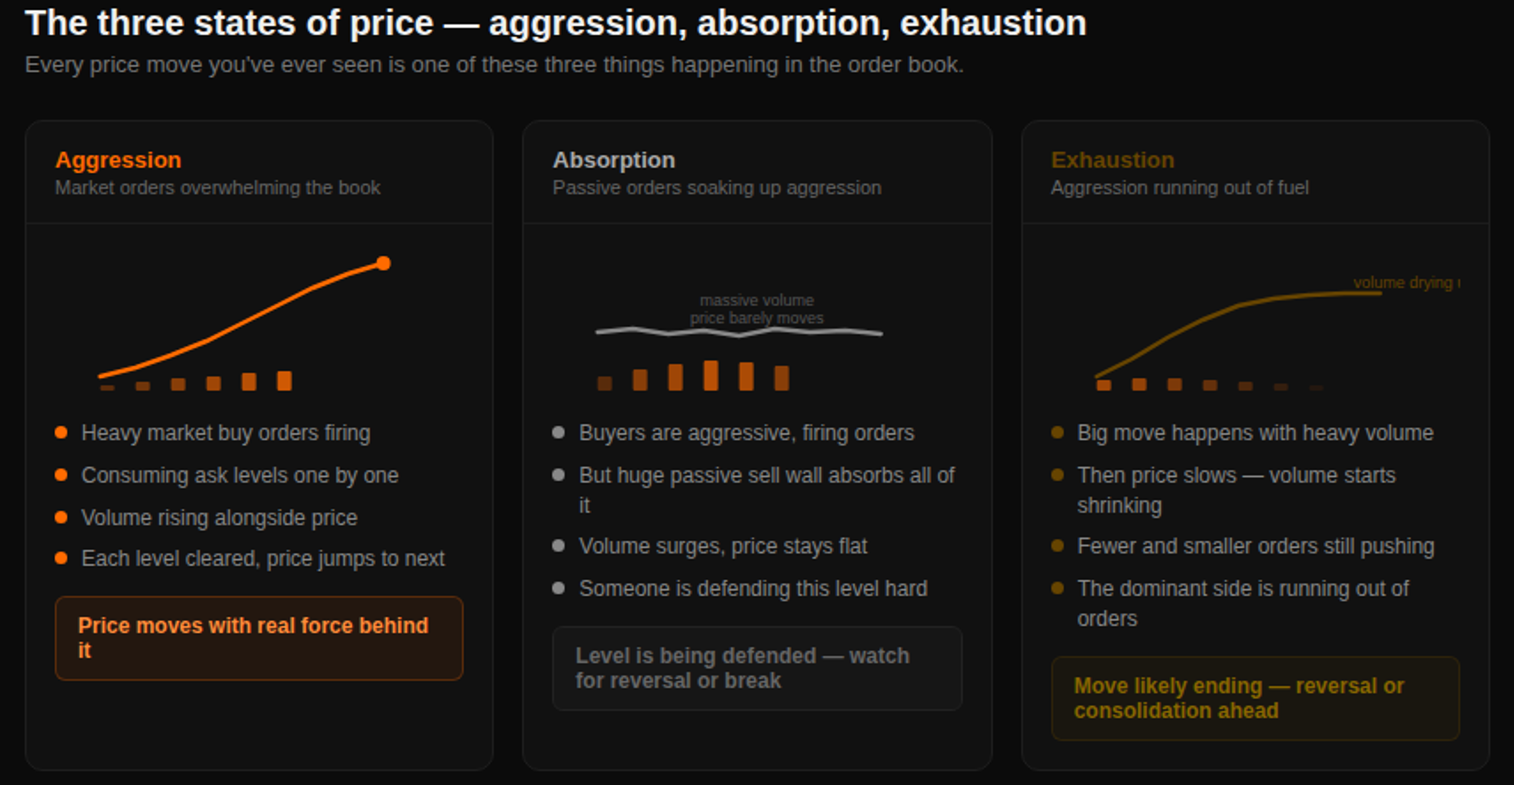
These three states tell you more about what price will do next than any indicator. Aggression with no absorption ahead = continuation. Aggression meeting a wall = stall or reversal. Volume rising but price not moving = absorption at work, watch for which side breaks.
The Market as an Auction
The cleanest way to think about all of this: the market is a continuous auction.
Price moves to where the most willing buyers meet the most willing sellers. When buyers are more aggressive — accepting higher and higher ask prices to get in — price moves up. It keeps going until it finds enough sell liquidity to slow it down. When it finds a level where sellers are stacking heavily, the auction pauses. Both sides are negotiating at that price.
This is why price often stalls at round numbers or major levels — not because of any mystical significance, but because that's where large players have concentrated their passive orders. The auction pauses there naturally.
When the balance breaks — either the wall gets consumed by relentless buying or it gets pulled by whoever placed it — the auction moves to a new price. This is a breakout.
Price Phases: Rotation, Breakout, Acceptance or Rejection
Markets don't trend forever. They cycle through phases, and each phase has a readable signature in the order book.
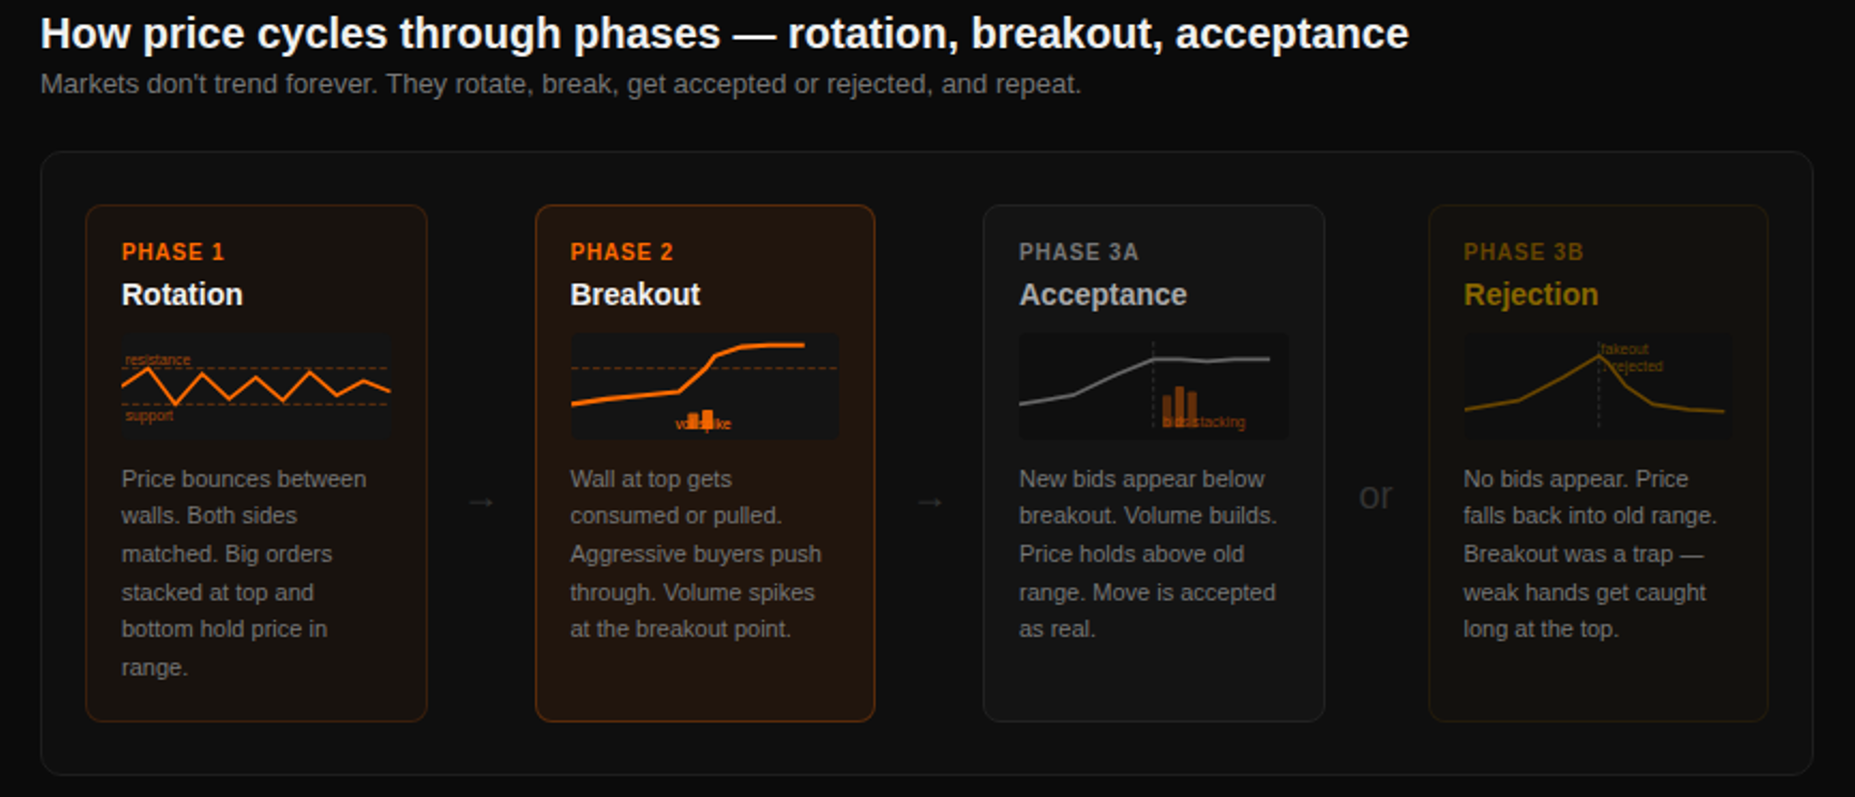
Rotation (balance) — price bounces between two walls. Big bid orders at the bottom, big ask orders at the top. Neither side has enough aggression to break through. Volume is moderate and balanced. The market is agreeing on a range of fair value. This phase continues until one wall gets consumed or pulled.
Breakout (imbalance) — the wall on one side disappears or gets overwhelmed by aggressive orders. Price escapes the range, often on a volume spike. This is the transition — but it doesn't confirm anything yet. The real question comes next.
Acceptance — price breaks out and new orders stack on the side it just left. Bids appear below a breakout to the upside, defending the new level. Volume builds. The market is accepting the new price as fair value. This is a real move.
Rejection — price breaks out but nothing follows. No new bids below an upside break. Volume is weak or absent. Price snaps back into the old range within minutes. This was a fakeout — someone pushed through a level, ran some stops, and had no intention of holding it.
The candle looks identical in both cases. The order book tells them apart.
Stop Runs: The Market's Favorite Trap
One of the most common price mechanics in crypto futures is the stop run — and once you understand it, you'll see it everywhere.
Most traders place their stops at obvious levels: just above a recent high, just below a recent low, at round numbers. Everyone knows these levels because they're "obvious." Which means large players know exactly where retail stops are clustered.
The mechanic works like this: a large player pushes price into the stop cluster deliberately. The stops trigger as market orders, which creates a burst of liquidity for the large player to fill their actual position against. Price spikes through the level, triggers everyone's stops, and then — if there's no real order flow continuation — immediately reverses back.
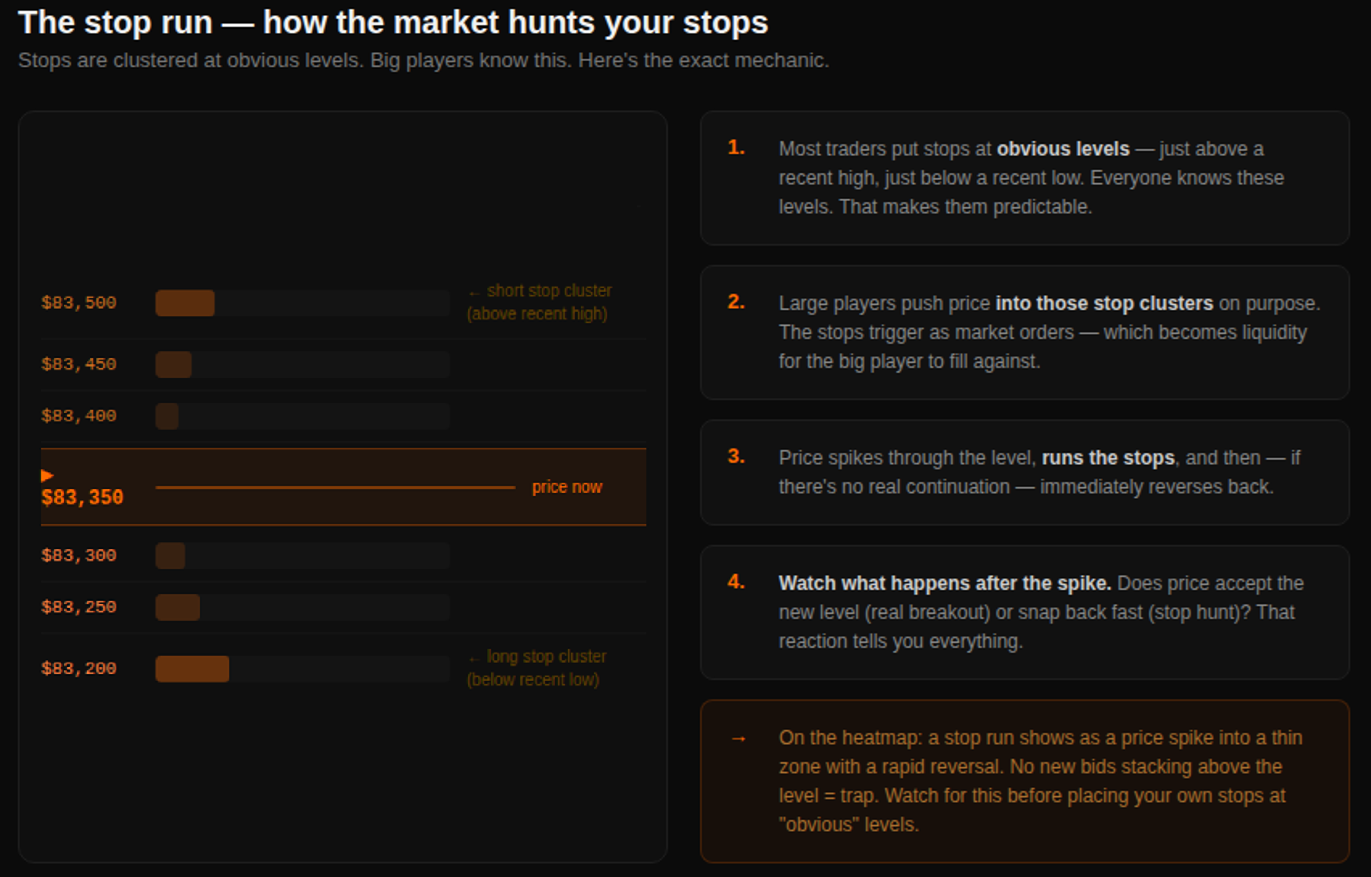
The retail trader gets stopped out at the worst possible price. The large player just got filled. The candle shows a wick. Most people call it "manipulation" and move on. But it's just mechanics — stops are liquidity, and liquidity gets hunted.
How to spot it: On the heatmap, a stop run looks like a price spike into a thin zone with no new orders stacking at the new level afterward. The bid side (for an upside stop run) stays empty. Price reverses fast. Compare this to a real breakout, where new bids immediately stack below the break level as the market accepts the new price.
Real Breakout vs Fakeout — Reading the Book
This distinction is worth spending time on because it's where most retail traders lose money. They chase breakouts that reverse and miss ones that hold.
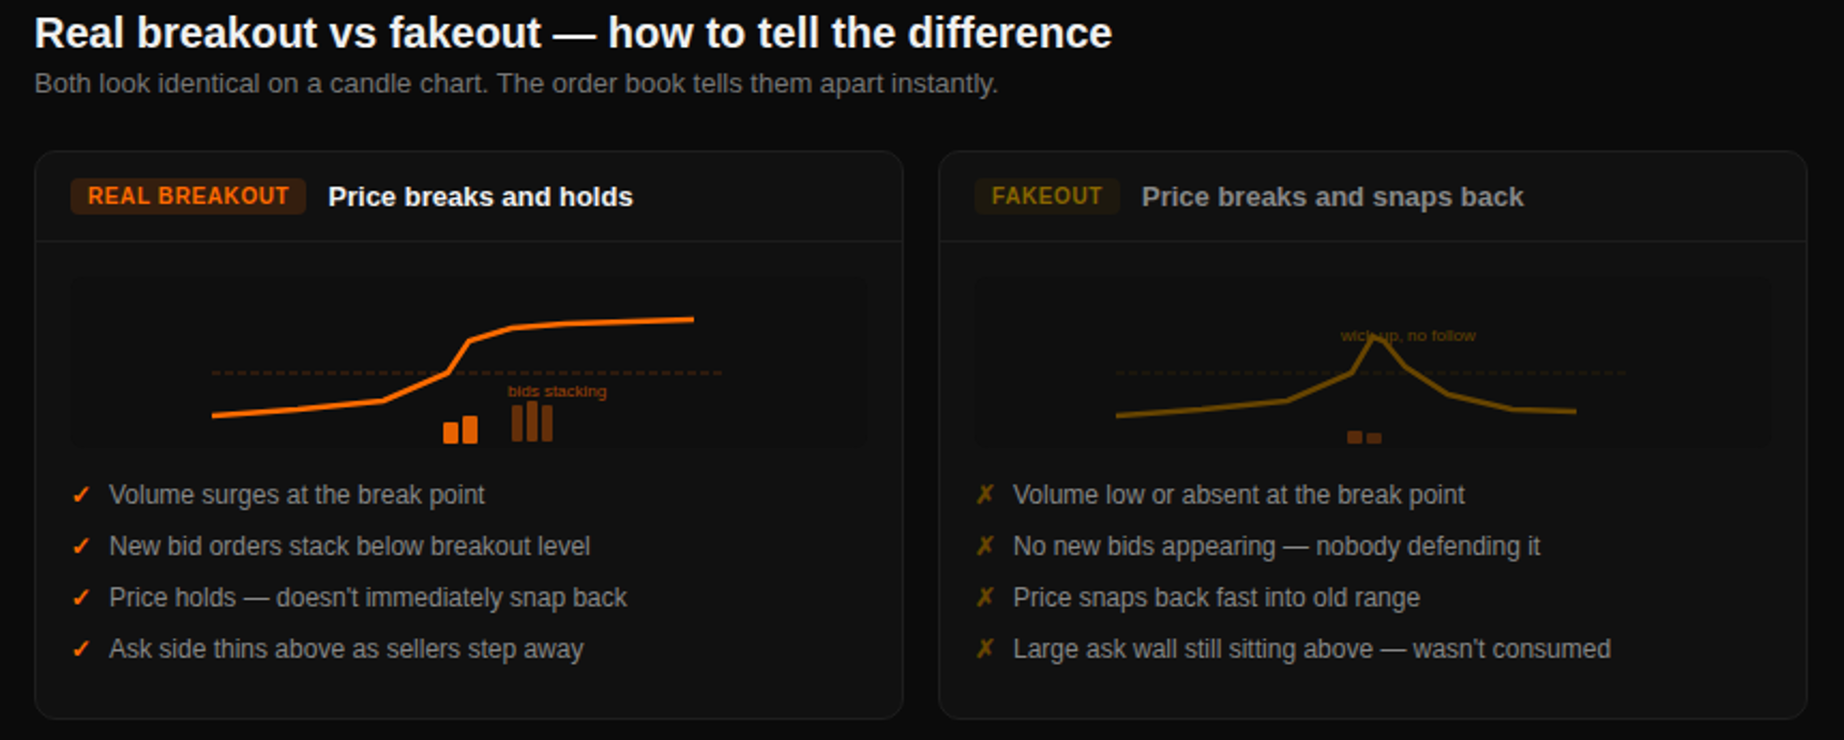
Signs of a real breakout in the order book:
- Volume spikes at the break point — aggression was real
- New orders stack on the side that was just broken through
- Ask side thins above the new level as sellers back away
- Price holds or consolidates above the old resistance
Signs of a fakeout:
- Volume is thin at the break — nobody backed it
- No new orders appear at the new level
- The original wall is still visible on the ask side — it wasn't consumed
- Price snaps back in minutes, often violently
The candle shows a breakout in both cases. One has order flow backing it. One doesn't. Without the book, you're guessing. With it, you can read the difference in real time before the reversal happens.
What This Means for Your Trades
Every entry you take happens in one of these contexts. Understanding where you are in the phase cycle and which state is dominant changes every decision:
Before entering a long at a support level, instead of asking "did this level hold before?" you ask: "is there a real bid wall here right now, and is it being defended or getting absorbed?" One question has a real-time answer.
Before chasing a breakout, instead of asking "is this breaking out?" you ask: "is there new order flow behind this move, or is it running on fumes into thin liquidity?" One question you can answer by watching the book.
Before placing your stop, instead of asking "where's the obvious level?" you ask: "where are stops likely to be clustered, and is that somewhere price is likely to sweep before the real move?" That question keeps you out of the most common trap in the market.
The mechanics don't change. Price always moves the same way — aggression hitting absorption until one side exhausts. Reading it is the skill.
QuantFlows visualizes aggression, absorption, and exhaustion in real time through Bubble Market Dots, CVD, and the live heatmap — across Binance, Bybit, OKX, and Hyperliquid simultaneously.